In a world overflowing with data, the most valuable insights often come from understanding not just what is happening, but where. This is the power of geo analysis. From a business planning its next move in the APAC region to a scientist tracking a pandemic, the ability to analyze data geographically transforms simple numbers into a strategic map.
Geo analysis is the key to unlocking location based intelligence. It’s a field that combines data science, statistics, and geography to reveal patterns, relationships, and trends that would otherwise remain hidden. Let’s explore the concepts, techniques, and technologies that make this powerful discipline work.
The Fundamentals of Geo Analysis
At its core, geo analysis is about examining data that has a spatial component. To do that, we need to understand a few foundational ideas.
Geospatial Analysis and Spatial Data
Geospatial analysis is the broad practice of using geographic data to solve problems. It integrates tools and information from statistics, economics, and computer science to help us understand spatial phenomena. A classic, life saving example is Dr. John Snow’s 1854 cholera map of London. By plotting cholera deaths on a map, he identified a contaminated water pump as the source of the outbreak, a foundational moment in public health.
This process relies on spatial data analysis, which involves the specific statistical methods used to test geographic hypotheses. Unlike standard data analysis, it must account for unique spatial challenges. For instance, the way data is grouped into regions, like census tracts, can create statistical quirks. It’s all about considering the where in addition to the what and how.
Spatial Dependence, Autocorrelation, and Association
Three concepts form the bedrock of most spatial statistics:
- Spatial Dependence: This is the simple but profound idea that things closer together are more related than things far apart. It’s formally known as Tobler’s First Law of Geography: “everything is related to everything else, but near things are more related than distant things.” For example, houses in the same neighborhood tend to have similar prices.
- Spatial Autocorrelation: This is how we measure spatial dependence. Positive spatial autocorrelation means similar values cluster together (like high income neighborhoods next to other high income neighborhoods). Negative spatial autocorrelation means dissimilar values are close (like a checkerboard pattern).
- Spatial Association: This looks at how two different variables are distributed in space. For example, is there a spatial association between areas with high poverty rates and areas with high crime rates? A strong association suggests a potential link or a common underlying factor worth investigating.
Spatial Heterogeneity and Interaction
The world isn’t uniform, and geo analysis accounts for this.
- Spatial Heterogeneity means that relationships and processes can change depending on the location. For example, the factors driving home prices in a dense city center are very different from those in a rural area. This is a critical concept for global businesses, as a marketing strategy that works in one country might fail in another. See our multilingual SEO guide for practical ways to adapt content by market. A one size fits all approach simply doesn’t work.
- Spatial Interaction describes the movement or flow of people, goods, and information between locations. This is often governed by the principle of distance decay, meaning interaction decreases as distance increases. We see this in daily commutes, international trade, and even the spread of ideas.
Core Techniques and Modeling in Geo Analysis
Once you understand the fundamentals, you can apply a range of powerful techniques to your data. This is where the real work of a geo analysis expert comes into play.
Estimating and Predicting with Spatial Data
- Spatial Interpolation: This is the process of intelligently “filling in the gaps” in your data. If you have temperature readings from scattered weather stations, interpolation can create a continuous temperature map for the entire region. Methods like Kriging are highly sophisticated, providing not just an estimate but also a measure of uncertainty.
- Spatial Regression: Traditional regression models assume data points are independent, an assumption often violated in geography. Spatial regression techniques are designed to handle spatial dependence, leading to more accurate models of relationships, like how proximity to a park impacts property values.
- Spatial Neural Networks: As part of the growing field of GeoAI, artificial neural networks are being adapted to analyze spatial data. Convolutional Neural Networks (CNNs) are excellent at learning features from satellite imagery, while other models can learn complex relationships in transportation networks or urban growth patterns.
Advanced Statistical Methods
- Geostatistics: This is a branch of statistics focused on analyzing spatially correlated data. Originally developed for the mining industry to estimate ore grades, it is now used in environmental science, hydrology, and more. A key tool is the variogram, which models how data similarity decreases with distance.
- Multiple Point Geostatistics (MPS): This is an advanced form of geostatistics that goes beyond simple pairs of points to capture complex, curvilinear patterns. It uses “training images” to reproduce realistic geological formations like river channels, something traditional methods struggle with.
- Simulation and Modeling: Spatial simulation involves creating computational models to mimic real world processes. This allows for “what if” scenarios, like simulating wildfire spread under different wind conditions or modeling urban growth based on new zoning policies.
The Technology Powering Modern Geo Analysis
Advanced techniques require powerful tools. Geographic Information Systems (GIS) and related technologies are the engines that drive modern geo analysis.
Geographic Information Systems (GIS)
A GIS is a software platform for capturing, managing, analyzing, and visualizing all types of geographic data. The widespread GIS use has made complex spatial analysis accessible across countless industries.
- Basic GIS Operations are the building blocks of any analysis. These include tasks like creating buffers (zones around features), performing spatial queries (“find all schools within this district”), and map overlay, where multiple data layers are combined to reveal relationships.
- Advanced GIS Operations tackle more complex problems. This includes network analysis to find the most efficient delivery routes, 3D analysis to model terrain and viewsheds, and automating complex workflows with scripting. Solving the famous Travelling Salesman Problem, which seeks the shortest route to visit multiple cities, is a classic advanced GIS application.
Data Collection and Management
- Mobile Geospatial Computing: Smartphones have put a powerful location aware computer in everyone’s pocket. This enables crowdsourced data collection (like traffic reporting on Waze) and powers countless location based services. For businesses, understanding mobile search behavior is critical for connecting with customers in the right place at the right time, especially across engines like Google and Naver in South Korea (Naver SEO in 2025).
- GPS Data Collection: The Global Positioning System (GPS) provides the foundational method for gathering accurate location information in the field. From mapping utility lines to tracking wildlife, GPS is how real world features get into our digital systems.
- Remote Sensing: This is the science of gathering data from a distance, typically using satellites or aircraft. Satellite imagery provides a continuous stream of information about the Earth’s surface, allowing us to monitor deforestation, track urban sprawl, and map land cover on a massive scale.
- Raster Data: Much of the data from remote sensing comes in a raster format. Raster data is a grid of cells or pixels, where each cell has a value representing information like elevation or temperature. It is perfect for representing continuous surfaces.
- Latitude and Longitude Attributes: At the simplest level, location is defined by latitude and longitude attributes. These coordinates form the global address system that allows any point on Earth to be precisely mapped and analyzed.
Navigating the Pitfalls of Geo Analysis
Working with spatial data comes with a unique set of challenges and potential fallacies. A skilled analyst knows how to recognize and mitigate them.
Problems of Boundaries and Scale
- The Boundary Problem: The way you draw the edges of your study area can distort your results. A cluster of activity near a border might look less significant if you don’t consider the data just across that artificial line.
- The Modifiable Areal Unit Problem (MAUP): This is a huge issue in geo analysis. It means that your results can change dramatically depending on how you group your data (the scale) and the shape of those groupings (the zoning). An analysis at the county level might show a different trend than one at the neighborhood level.
- The Modifiable Temporal Unit Problem (MTUP): This is the time based equivalent of MAUP. Your conclusions can change if you analyze data by week, month, or year.
Problems of Context and Interpretation
- The Uncertain Geographic Context Problem (UGCoP): It can be difficult to know the true geographic “context” that influences a person or event. Does a person’s health depend on their immediate block, their census tract, or their entire daily travel path? Different assumptions can lead to different results.
- The Neighborhood Effect Averaging Problem (NEAP): This problem arises because people don’t stay in one place. The influence of a person’s home neighborhood might be diluted because they spend so much time at work, school, or elsewhere, “averaging out” their environmental exposures.
- The Ecological Fallacy: This is a classic error where you assume that a trend observed for a group holds true for the individuals within that group. For example, just because wealthy neighborhoods have low crime rates doesn’t mean every wealthy individual is law abiding.
- The Locational Fallacy: This error comes from oversimplifying a location. Pinning a person’s entire existence to their home address ignores their mobility and can lead to flawed conclusions about exposure to things like pollution or access to services.
- The Atomic Fallacy: This is the opposite of the ecological fallacy. It’s the mistake of assuming that what is true for individuals must be true for the group. Group dynamics are more complex than the simple sum of their parts.
Visualizing Spatial Data: Making Sense of the Map
A key part of geo analysis is presenting the findings. Effective mapping and visualization turn complex data into clear, intuitive insights.
Creating and Interacting with Maps
- World Map Visualization: Displaying data globally is tricky because you can’t flatten a sphere without distortion. The common Mercator projection, for example, makes Greenland look as large as Africa, when Africa is actually 14 times bigger. Choosing the right projection is key to telling an honest story.
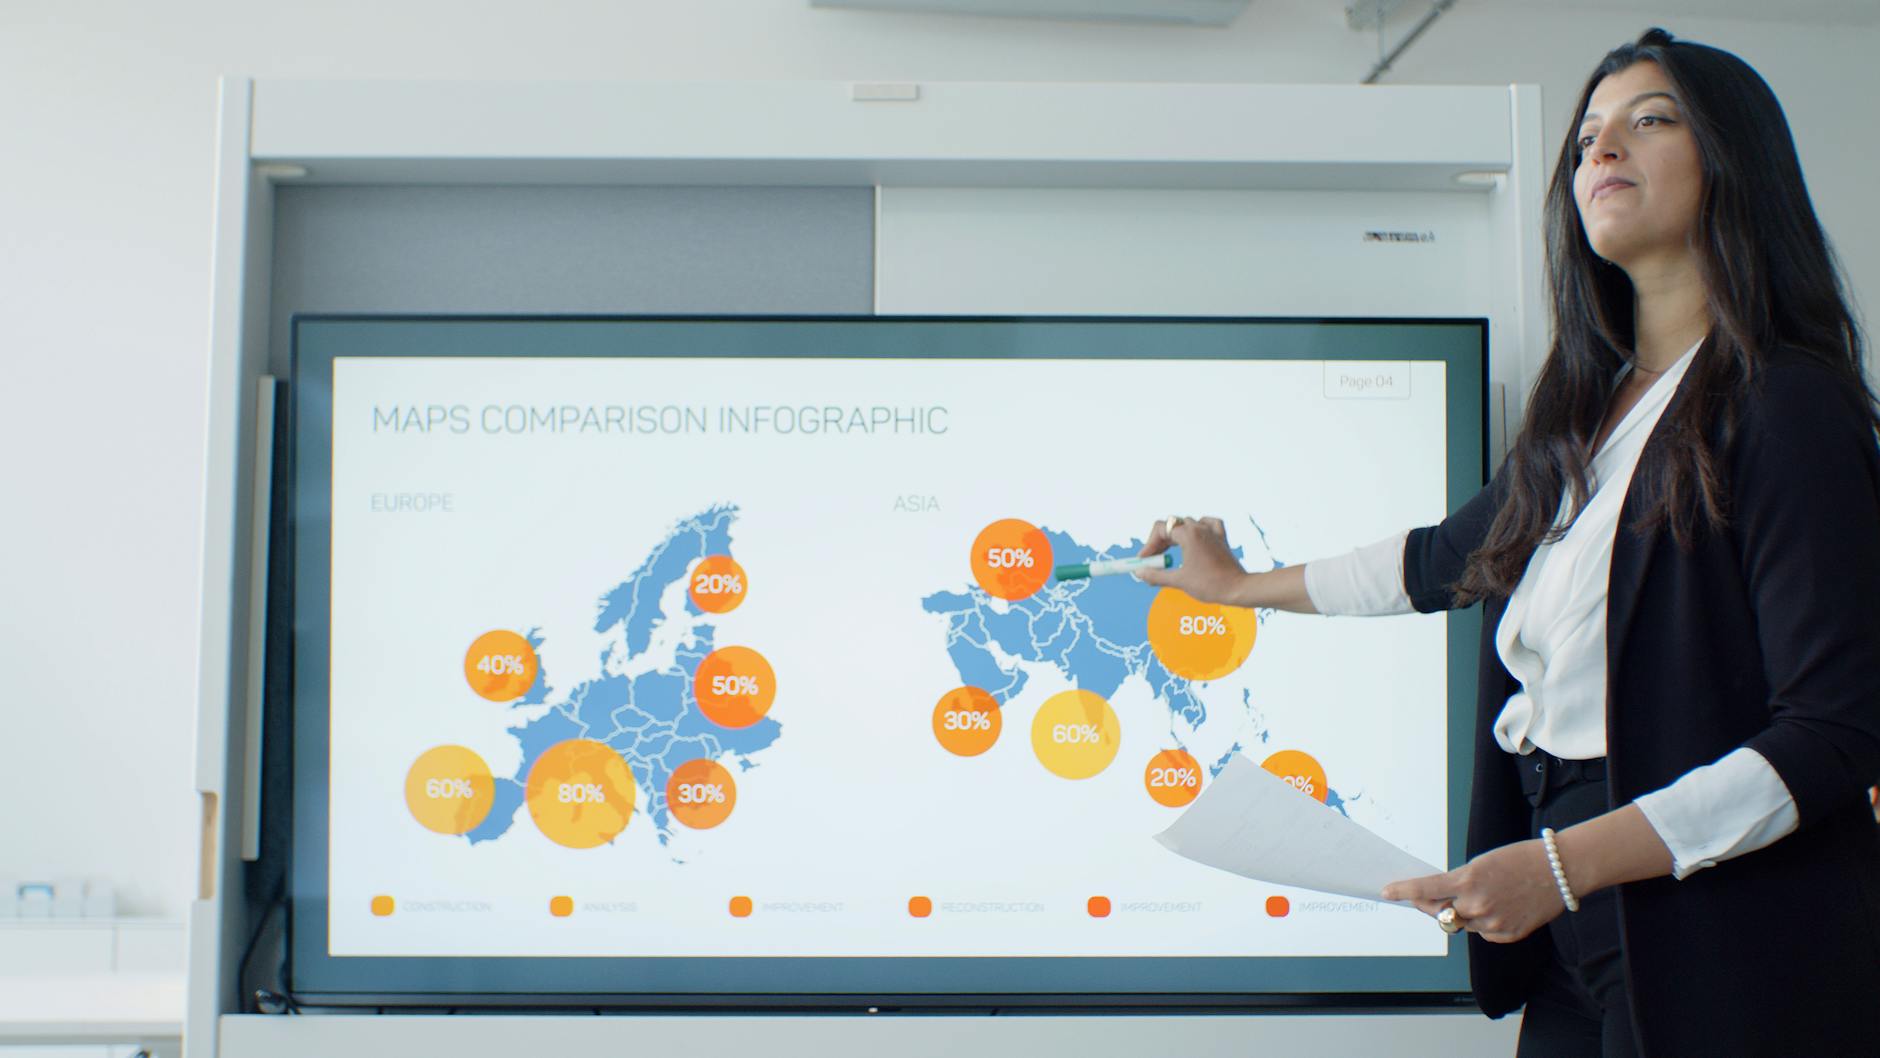
- Symbol Size and Color Encoding: These are the basic tools of cartography. We use the size of a symbol (like a circle) to show quantity and color to show category or intensity. A well designed map uses these elements to guide the eye and communicate patterns effectively.
- Map Navigation: In digital maps, navigation includes the ability to pan, zoom, and rotate. Good navigation tools allow users to seamlessly explore the data from a global overview down to a street level view.
- Area Selection and Filtering: This interactive feature allows users to draw a shape on a map to select and analyze data only within that specific region. It’s a powerful way to focus an inquiry on an area of interest.
- Location Preset: This is a practical software feature, like a saved favorite. Having presets for “Home,” “Work,” or key project sites allows users to quickly jump to important locations without re entering information.
Real World Applications of Geo Analysis
The true value of geo analysis is demonstrated in how it solves real problems across various domains.
Strategic Planning and Decision Making
- Site Selection Analysis: This is a classic business application used to find the best location for a new store, warehouse, or facility. It involves overlaying multiple spatial criteria, such as demographics, transport access, and competitor locations, to identify optimal sites. A foundational concept here is the Weber Problem, which seeks to find a location that minimizes total transportation costs to a set of destinations.
- Risk Prediction Mapping: This involves creating maps that forecast where adverse events are most likely to occur. Examples include mapping flood zones, wildfire risk areas, or seismic hazards. These maps are essential for disaster preparedness, urban planning, and the insurance industry.
- Disease Mapping: As pioneered by John Snow, mapping the geographic distribution of diseases helps public health officials identify clusters, understand transmission patterns, and target interventions to the areas that need them most.
The Importance of Asking the Right Questions
Ultimately, the success of any project depends on spatial question formulation. This is the critical first step of framing your inquiry in a way that acknowledges the importance of location. Instead of asking “What is our customer demographic?”, a better question is “Where do our high value customers live, and how do their locations differ from our other customer segments?”. Pair this with international SEO keyword research to capture how demand varies by region and language.
Asking the right spatial questions ensures you use the right data and the right geo analysis techniques. It’s the difference between a generic report and an actionable, location aware strategy. For businesses looking to expand into new territories like the APAC region, formulating these questions correctly is essential for understanding diverse local markets and customer behaviors, and aligning them with an international targeting strategy. If you need help turning your business goals into a data driven spatial strategy, the experts at BubbleShare can help you frame the right questions and find the answers on the map.
Conclusion
From its historical roots in a London cholera outbreak to its modern application in AI driven market analysis and Generative Engine Optimization (GEO), geo analysis has proven to be an indispensable discipline. By understanding its core concepts, leveraging powerful GIS technology, and being mindful of its potential pitfalls, we can uncover deep insights that are tied to the real world.
In an increasingly connected yet diverse world, knowing where is just as important as knowing what. Whether you are optimizing a supply chain, planning a city, or launching a product in a new country, geo analysis provides the framework for making smarter, more informed decisions.
Ready to see how a localized geo analysis strategy can reveal opportunities for your brand? Get a free AI Visibility Report from BubbleShare to benchmark your presence in key markets across the globe.
Frequently Asked Questions (FAQ)
1. What is the difference between GIS and geo analysis?
GIS (Geographic Information System) is the technology, the software and hardware used to work with geographic data. Geo analysis is the process, the set of analytical methods and techniques you apply using a GIS to interpret spatial patterns and answer questions. Think of GIS as the kitchen and geo analysis as the cooking.
2. What are some common examples of geo analysis in daily life?
You use the results of geo analysis every day. When your navigation app finds the fastest route to work, that’s network analysis. When you search for “restaurants near me,” that’s a spatial query. Weather maps showing rainfall predictions are another form of risk prediction mapping.
3. What skills are needed for a career in geo analysis?
A career in geo analysis typically requires a blend of skills. These include proficiency with GIS software (like ArcGIS or QGIS), a strong understanding of statistical concepts (especially spatial statistics), data management and programming skills (like Python or R), and critical thinking to formulate good spatial questions.
4. Can geo analysis predict the future?
Geo analysis can’t predict the future with certainty, but it is excellent at forecasting and modeling probable outcomes. By analyzing historical data and contributing factors, it can create risk maps or simulation models that show where future events are most likely to occur, which is invaluable for planning and mitigation.
5. How is AI changing the field of geo analysis?
AI is having a major impact. Machine learning algorithms are being used to identify complex patterns in large spatial datasets, from classifying land cover in satellite images to predicting urban growth. This fusion, often called GeoAI, is making geo analysis faster, more powerful, and capable of tackling previously unsolvable problems. For marketing teams navigating AI‑influenced discovery, see our AI search optimization playbook.
6. Why is geo analysis so important for businesses expanding into new regions?
Because every market is different. Geo analysis allows a business to move beyond generic strategies and understand the unique spatial dynamics of a new region. It helps answer critical questions like: Where are our target customers concentrated? Where are our competitors located? What cultural or logistical factors vary by location? Answering these questions is key to successful localization. For a practical framework, see our SEO localization guide for global markets.
7. What is the first step to get started with geo analysis?
The first step is always formulating a clear spatial question. Before you touch any data or software, you need to know what you are trying to answer. What is the problem, and how does location play a role in it? A well defined question will guide your entire analysis from start to finish.
8. Where can I find spatial data for my project?
There are many sources for spatial data. Government agencies often provide free data through open data portals (e.g., census data, environmental maps). OpenStreetMap is a great source for global base map data. Additionally, commercial data providers offer specialized datasets for demographics, business locations, and more.